
Model Evaluation
sklearn has provide a vast nunmber of tools for model evaluation.
Generic Measures
Confusion Matrix
| Predicted Class | Predicted Class | ||
|---|---|---|---|
| + (Positive) | - (Negative) | ||
| Acutal Class | + (Positive) | TP | FN |
| Acutal Class | - (Negative) | FP | TN |
Accuracy
Accuracy : Overall, how often is the classifier correct?. It is one (most basic) metric for evaluating classification models,
\[\text{Accuracy} = \frac{\text{Number of correct predictions}}{\text{Total number of predictions}}\] \[\text{Accuracy} = \frac{TP+TN}{TP+TN+FP+FN}\]True Positive Rate (TPR), Recall In all positives,how many is classified as positive correctly:
\[\text{Recall} = \frac{TP}{TP+FN}\]Precision: When it predicts positive, how often is it correct?
\[\text{Precision} = \frac{TP}{TP+FP}\]False Positive Rate (FPR) In all negetives,how many is classified as positive wrongly:
\[\text{FPR} = \frac{FP}{FP+TN}\]ROC, AUC
ROC curve is defined based on the confusion matrix focusing on TPR and FPR.
The most important advantage for ROC is that it can show the performance of the classifier for all possible thresholds(parameters), while accuracy can only show the performance for certain parameters.
Area Under the Curve, or AUC, is a numerical measure to evaluate the performance of the classifier. A good illustration is:
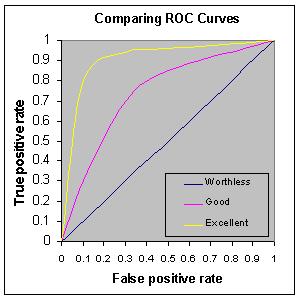
Where we have the following guide:
- .90-1 = excellent (A)
- .80-.90 = good (B)
- .70-.80 = fair (C)
- .60-.70 = poor (D)
- .50-.60 = fail (F)
A good explanation of ROC and AUC can be found here.
Metrics for Regression
Plot of Predicted vs. Real
Quantiles for a probability plot (QQ-plot). scipy
Residual Plots
Mean Squared Error (MSE)
\[\text{MSE}=\frac1n\sum^n_{i=1}(Y_i-\hat Y_i)^2\]Mean Absolute Error (MAE)
\[\text{MSE}=\frac1n\sum^n_{i=1}\left|Y_i-\hat Y_i\right|^2\]